The Great Garden Graph
Before we jump into the story, let’s warm up with a few fun questions. Read the questions and answer.
Well done! Continue to the gate.
One sunny afternoon, Eli and I were working in my little garden. I wanted to keep track of my plants’ growth. “We could make a graph to see how each plant grows,” Eli suggested. I was curious. “What is a graph?” I asked.
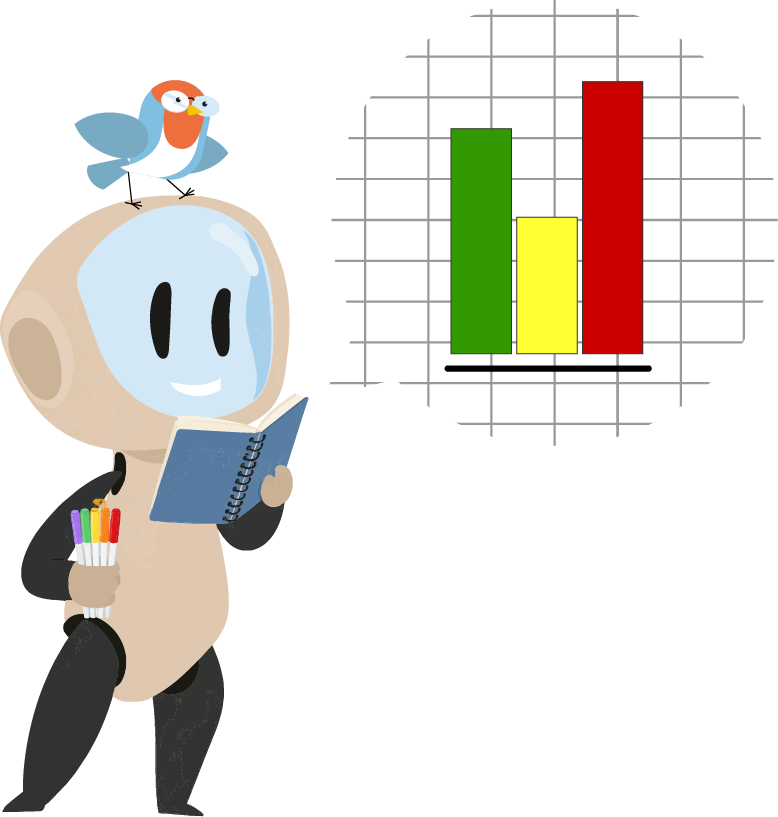
Eli chirped, “A graph is a picture that shows information, like how many plants you have or how they grow over time. ” She handed me a small notebook and some colourful markers. “Let’s start with a bar chart,” she explained.
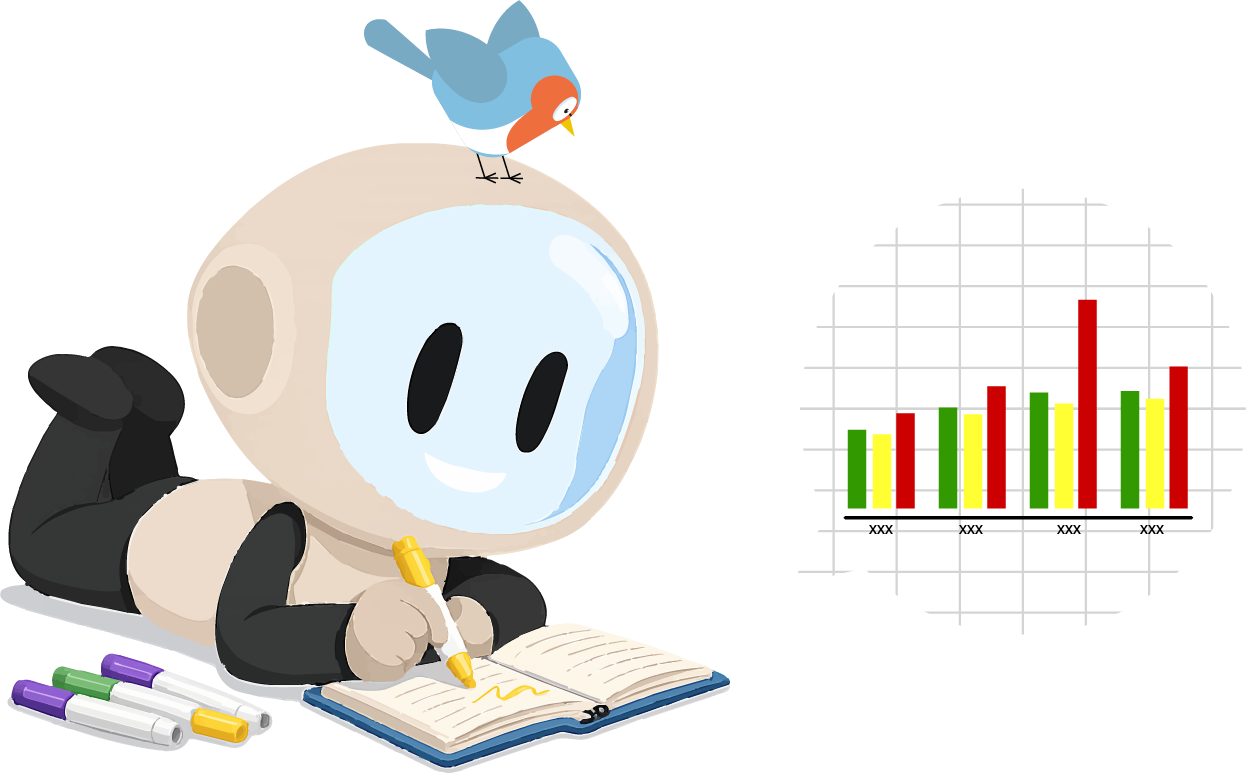
We decided to track how many tomatoes, cucumbers, and peppers I picked each month. I drew three bars: red for tomatoes, green for cucumbers, and yellow for peppers. When I looked at the bars, I noticed that the red bar was the tallest in July. I asked, “Does that mean I picked the most tomatoes in July?”. Eli nodded, “Yes! July was a great month for tomatoes.”


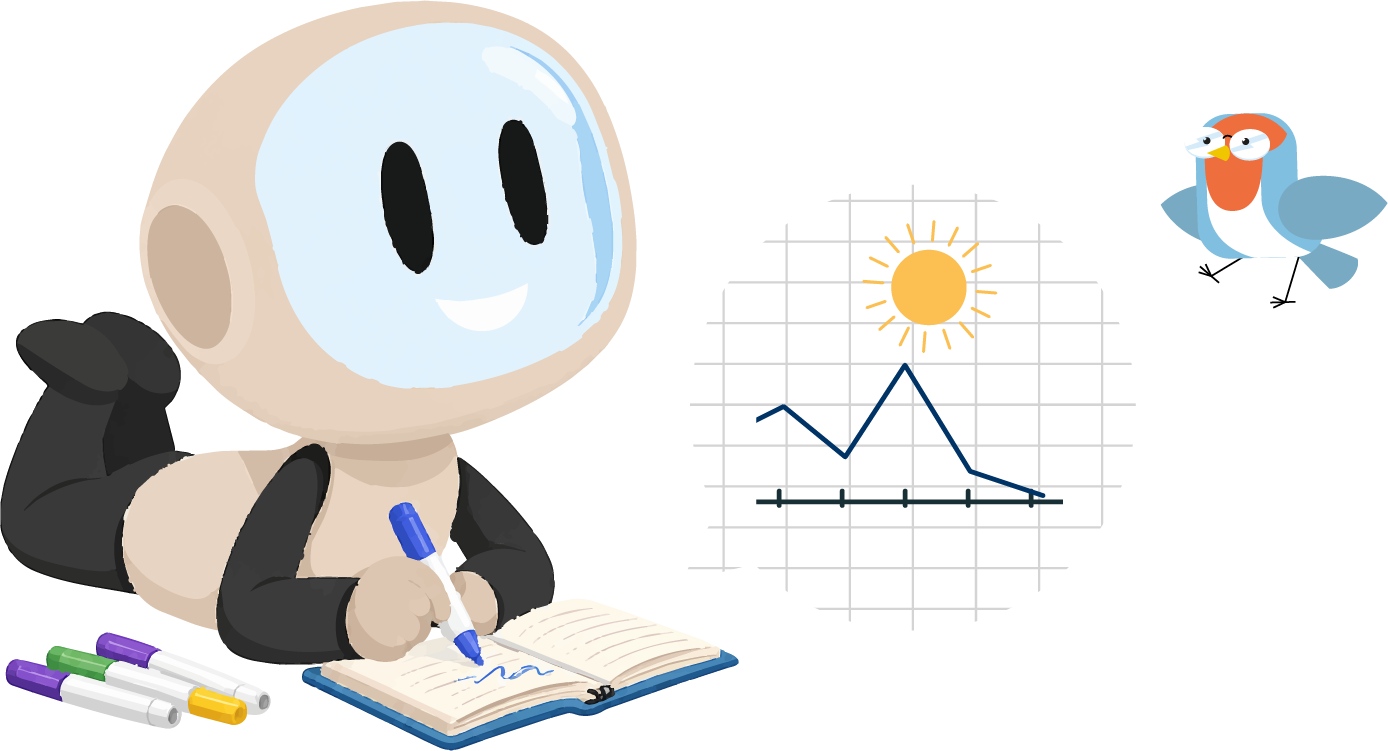
Next, we decided to make a line graph to track how much water each plant got. Eli explained, “This line will go up when it rains a lot and down when it’s dry.”

We drew a line across the page. It started high in May but dropped low in June. I said, “So, June was a dry month.” Eli chirped happily, “Exactly! Graphs can show us these changes easily.”
Feeling confident, I asked, “Can we make another graph with what we see in the garden today?” Eli thought that was a great idea. We decided to rack the different colours of flowers in the garden. But as we counted the flowers, we realized there was a problem. The blue flowers were very hard to spot among the green leaves.

I frowned. I said, “Eli, I can’t find any more blue flowers. Did we make a mistake?” Eli shook her head, “No, Riri. Sometimes data isn’t clear because it’s hard to see everything. Let’s look carefully again.”

We searched together, moving slowly and checking every corner of the garden. After a while, we found a few more blue flowers hidden under the big leaves! We added them to our chart, and it looked much better now. “We did it!” I cheered. “Now our graph shows the real number of each flower color.”
Eli chirped in agreement, “Yes, Riri. Sometimes, gathering data takes a bit more effort, but it’s worth it.”
As we put our notebook away, Eli said, “Now you know how to read and make a graph, Riri.” I nodded, excited about our new skill. I said, “I can’t wait to make more graphs about other things I find!”
Eli replied, “Graphs are a fun way to learn about the world around us!” We left the garden, inspired to explore more data and make more charts.
Now that we’ve read the adventure, read each question and answer
Well done! Continue to the gate.